Matplotlibのサイトを見ていたらこんなことができるんだ、という発見がありましたので、備忘としてメモしておきます。
グラフの指定範囲(例えば2つのグラフに挟まれる範囲)を塗りつぶして表示することができます。ビジュアライズのときに役に立つんじゃないかなと思っています。
範囲を指定しての塗りつぶし
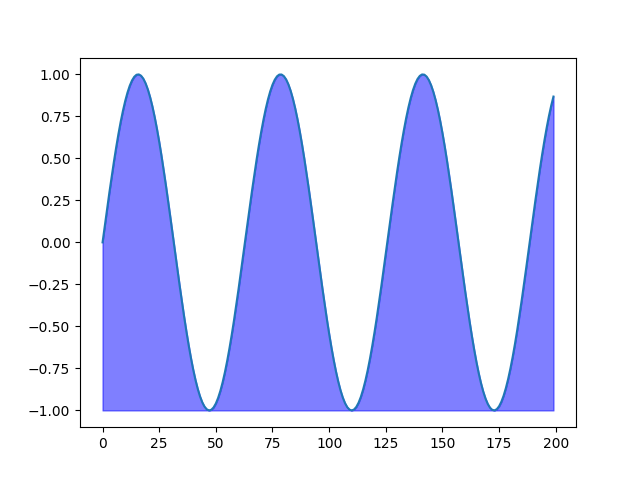
fillbetween()を使うとグラフの塗りつぶしができます。ここでは、グラフの最小値を塗りつぶしの範囲に指定することで、グラフの内部を塗りつぶしています。
# 0~100のランダム値(整数)を生成
x = [i for i in range(200)]
y = [np.sin(i/10) for i in range(200)]
_, ax = plt.subplots()
x = np.array(x)
y = np.array(y)
ax.plot(x, y)
# y.min()とグラフの間の範囲を塗りつぶし
ax.fill_between(x, y.min(), y, alpha=0.5, color='b')
# 0~100のランダム値(整数)を生成
x = [i for i in range(200)]
y = [np.sin(i/10) for i in range(200)]
_, ax = plt.subplots()
x = np.array(x)
y = np.array(y)
ax.plot(x, y)
# y.min()とグラフの間の範囲を塗りつぶし
ax.fill_between(x, y.min(), y, alpha=0.5, color='b')
# 0~100のランダム値(整数)を生成 x = [i for i in range(200)] y = [np.sin(i/10) for i in range(200)] _, ax = plt.subplots() x = np.array(x) y = np.array(y) ax.plot(x, y) # y.min()とグラフの間の範囲を塗りつぶし ax.fill_between(x, y.min(), y, alpha=0.5, color='b')
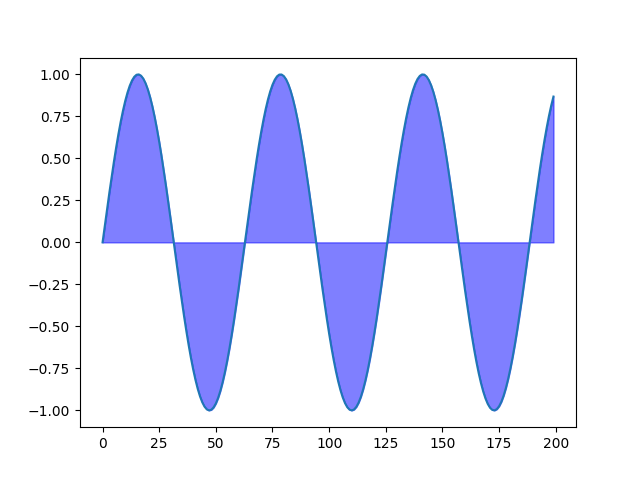
ちなみに、fill_between()は指定した数値とグラフに囲まれた部分を塗りつぶすため、指定した値がグラフの最小値でない場合、下のような塗りつぶし結果になります。
ax.fill_between(x, 0, y, alpha=0.5, color='b')
グラフ同士を比較しての塗りつぶし
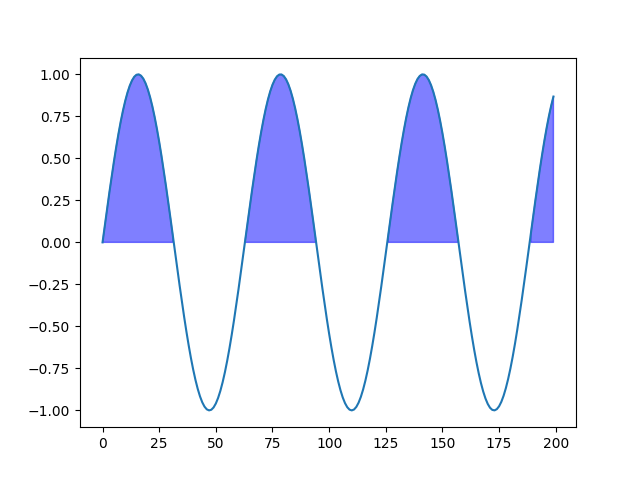
塗りつぶし対象を0以上に制限したい場合は、whereを使います。where=以降の条件を満たす箇所のみが塗りつぶされるため、0よりも小さい範囲を塗りつぶし対称から外すことができます。
なお、whereで比較するときは、どちらもサイズの等しいnp.array形式にしておく必要があります。おそらく、bool値による判定を行っているのだと思いますが、リスト形式で与えた場合には正しく動作しません。
threshold_arr = np.zeros_like(y)
ax.fill_between(x, threshold_arr, y, where=y >= threshold_arr, alpha=0.5, color='b')
threshold_arr = np.zeros_like(y)
ax.fill_between(x, threshold_arr, y, where=y >= threshold_arr, alpha=0.5, color='b')
threshold_arr = np.zeros_like(y) ax.fill_between(x, threshold_arr, y, where=y >= threshold_arr, alpha=0.5, color='b')
whereを使うことで、0以上の場合と0未満の場合とでの色分けもできるようになります。
threshold_arr = np.zeros_like(y)
ax.fill_between(x, threshold_arr, y, where=y >= threshold_arr, alpha=0.5, color='b')
ax.fill_between(x, threshold_arr, y, where=y < threshold_arr, alpha=0.5, color='r')
threshold_arr = np.zeros_like(y)
ax.fill_between(x, threshold_arr, y, where=y >= threshold_arr, alpha=0.5, color='b')
ax.fill_between(x, threshold_arr, y, where=y < threshold_arr, alpha=0.5, color='r')
threshold_arr = np.zeros_like(y) ax.fill_between(x, threshold_arr, y, where=y >= threshold_arr, alpha=0.5, color='b') ax.fill_between(x, threshold_arr, y, where=y < threshold_arr, alpha=0.5, color='r')
注意点
1点注意事項として、塗りつぶし判定に連続的な値を用いているわけでありませんので、あまり疎なデータを与えると見た目がイマイチになってしまいます。
# データ数を小さくする
x = [i for i in range(20)]
y = [np.sin(i) for i in range(20)]
x = np.array(x)
y = np.array(y)
_, ax = plt.subplots()
ax.plot(x, y)
# 0以上、0未満で塗りつぶしの色分け
threshold_arr = np.zeros_like(y)
ax.fill_between(x, threshold_arr, y, where=y >= threshold_arr, alpha=0.5, color='b')
ax.fill_between(x, threshold_arr, y, where=y < threshold_arr, alpha=0.5, color='r')
# データ数を小さくする x = [i for i in range(20)] y = [np.sin(i) for i in range(20)] x = np.array(x) y = np.array(y) _, ax = plt.subplots() ax.plot(x, y) # 0以上、0未満で塗りつぶしの色分け threshold_arr = np.zeros_like(y) ax.fill_between(x, threshold_arr, y, where=y >= threshold_arr, alpha=0.5, color='b') ax.fill_between(x, threshold_arr, y, where=y < threshold_arr, alpha=0.5, color='r')